R語言二項分布
二項式分布模型涉及尋找具有在一係列實驗中隻有兩種可能的結果的事件的成功的概率。對於一個硬幣的例子折騰總是給出一個正麵或反麵。發現正是3個正麵,在反複擲硬幣10次的概率是二項分布估計的期間。
R語言有四個內置函數生成二項分布。它們被描述如下。
dbinom(x, size, prob)
pbinom(x, size, prob)
qbinom(p, size, prob)
rbinom(n, size, prob)
以下是所使用的參數的說明:
- x 是數字向量。
- p 是概率的向量。
- n 是觀測次數。
- size 是試驗次數。
- prob 是每次試驗的成功概率。
dbinom()
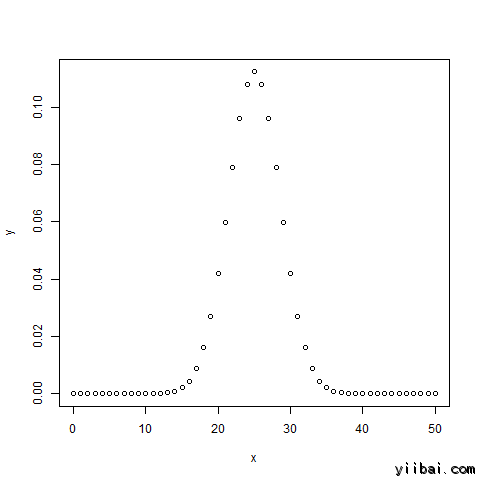
此函數可以讓每個點顯示的概率密度分布。
# Create a sample of 50 numbers which are incremented by 1.
x <- seq(0,50,by=1)

# Create the binomial distribution.
y <- dbinom(x,50,0.5)

# Give the chart file a name.
png(file = "dbinom.png")

# Plot the graph for this sample.
plot(x,y)

# Save the file.
dev.off()
當我們上麵的代碼執行時,它產生以下結果:
pbinom()
此函數給出了一個事件的累積概率。它是表示單個值的概率。
# Probability of getting 26 or less heads from a 51 tosses of a coin.
x <- pbinom(26,51,0.5)

print(x)
當我們上麵的代碼執行時,它產生以下結果:
[1] 0.610116
qbinom()
這個函數的概率值,並給出了一個數字,其累加值相匹配概率值。
# How many heads will have a probability of 0.25 will come out when a coin is tossed 51 times.
x <- qbinom(0.25,51,1/2)

print(x)
當我們上麵的代碼執行時,它產生以下結果:
[1] 23
rbinom()
這個函數從給定的樣本生成概率隨機值所需的數目。
# Find 8 random values from a sample of 150 with probability of 0.4.
x <- rbinom(8,150,.4)

print(x)
當我們上麵的代碼執行時,它產生以下結果:
[1] 58 61 59 66 55 60 61 67

