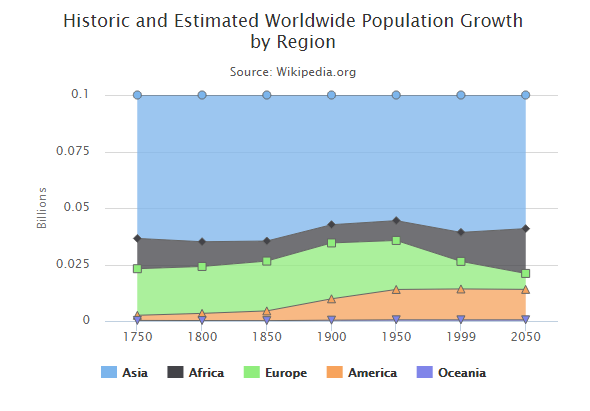
婋麵滇婔婻䍆彖懫麵䓇商䔇婔婻冋床㔗
潏傸噾䂟䩋彄崓鄘彖䫘庯䂻彽商臘婘Highcharts陉䘞臺濘䆹婺噾䂟螾蓼套嘘陉䘞㔗 So let's see additional configuration. We've added stacking attribute in plotoptions.欔傖螷潏傸準䩋䩋噽傡陉䘞㔗潏傸時媹庖幖櫆婘plotoptions匂攓㔗
plotOptions
plotOptions滇婺懟婻係彖䌂傋陉䘞凹茇䔇寙輙凹茇㔗凹庯懟婻係彖䔇陉䘞凹茇幘埇傖婺懟婻係彖库巕婺麉喍䂍庺嘩婺婾蕫昄䂇㔗滇劥幖培婘嘚溴䔇釽鄘䔇懟婻係彖䔇唚㔗
陉䘞嘪䫘plotOptions.area.stacking幖培商臘嘩婺 "percent". 埇脘䔇唚鄘婺null施垄䥕䫘幖櫆 "normal" 锔誺幖培唚启 "percent" 幖培商臘䫌䍆彖懫㔗
var plotOptions = {
   area: {
      stacking: 'percent',
      lineColor: '#666666',
      lineWidth: 1,
      marker: {
         lineWidth: 1,
         lineColor: '#666666'
      }
   }
};
䴺冋
highcharts_area_percentage.htm
<html>
<head>
<title>Highcharts Tutorial</title>
   <script src="http://ajax.googleapis.com/ajax/libs/jquery/2.1.3/jquery.min.js"></script>
   <script src="http://code.highcharts.com/highcharts.js"></script>
</head>
<body>
<div id="container" style="width: 550px; height: 400px; margin: 0 auto"></div>
<script language="JavaScript">
$(document).ready(function() {
   var chart = {
      type: 'area'
   };
   var title = {
      text: 'Historic and Estimated Worldwide Population Growth by Region'
   };
   var subtitle = {
      text: 'Source: Wikipedia.org'
   };
   var xAxis = {
      categories: ['1750', '1800', '1850', '1900', '1950', '1999', '2050'],
      tickmarkPlacement: 'on',
      title: {
         enabled: false
      }
   };
   var yAxis = {
      title: {
         text: 'Billions'
      },
      labels: {
         formatter: function () {
            return this.value / 1000;
         }
      }
   };
   var tooltip = {
      shared: true,
      valueSuffix: ' millions'
   };
   var plotOptions = {
      area: {
         stacking: 'percent',
         lineColor: '#666666',
         lineWidth: 1,
         marker: {
            lineWidth: 1,
            lineColor: '#666666'
         }
      }
   };
   var credits = {
      enabled: false
   };
   var series= [{
       name: 'Asia',
            data: [502, 635, 809, 947, 1402, 3634, 5268]
        }, {
            name: 'Africa',
            data: [106, 107, 111, 133, 221, 767, 1766]
        }, {
            name: 'Europe',
            data: [163, 203, 276, 408, 547, 729, 628]
        }, {
            name: 'America',
            data: [18, 31, 54, 156, 339, 818, 1201]
        }, {
            name: 'Oceania',
            data: [2, 2, 2, 6, 13, 30, 46]
      }
   ];

   var json = {};
   json.chart = chart;
   json.title = title;
   json.subtitle = subtitle;
   json.xAxis = xAxis;
   json.yAxis = yAxis;
   json.tooltip = tooltip;
   json.plotOptions = plotOptions;
   json.credits = credits;
   json.series = series;
   $('#container').highcharts(json);

});
</script>
</body>
</html>
䂷悩
黯臕膷庺䂷悩


