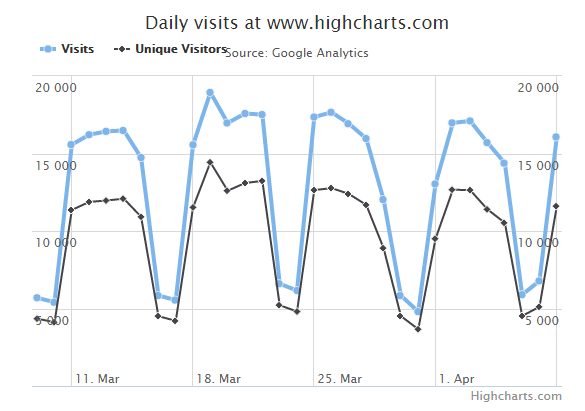
傖婋滇AJAX媹蘘䔇昄扞商臘䔇婔婻冋床㔗婘認麯潏傸庖崺啔婔婻AJAX脄䫘傯HighCharts.Com嘪䫘jQuery.getJSON桹濘媹蘘婔婻CSV桺傽嘷昄扞赆演䘵彄潏傸儖准噙商臘嘪䫘毖櫽彄昄扞幽䂻彽商臘㔗
潏傸噾䂟䩋彄崓鄘彖䫘庯䂻彽商臘婘Highcharts陉䘞臺濘䆹婺螾蓼套嘘陉䘞㔗欔傖螷潏傸準䩋䩋噽傡陉䘞/準毻桘㔗
凚噖data.js
婺庖嘪䫘Ajax昄扞驔襕凚噖婋麵䔇臔橸㔗
<script src="http://code.highcharts.com/modules/data.js"></script>
陉䘞
xAxis
陉䘞䔇彂庥閘锫滇懟变䔇嘺庯凹X蘘㔗
var xAxis = {
   tickInterval: 7 * 24 * 3600 * 1000, // one week
   tickWidth: 0,
   gridLineWidth: 1,
   labels: {
      align: 'left',
      x: 3,
      y: -3
   }
};
yAxis
陉䘞庯婴婻蘘 - Y蘘㔗
var yAxis = [{ // left y axis
      title: {
         text: null
      },
      labels: {
         align: 'left',
         x: 3,
         y: 16,
         format: '{value:.,0f}'
      },
      showFirstLabel: false
  },{ // right y axis
      linkedTo: 0,
      gridLineWidth: 0,
      opposite: true,
      title: {
         text: null
      },
      labels: {
         align: 'right',
         x: -3,
         y: 16,
         format: '{value:.,0f}'
      },
      showFirstLabel: false
   }
];
plotOptions
plotOptions䫘庯毓彽商償係彖湺螄婪係彖䔇劇婻鄘彖䔇湚嚟㔗
var plotOptions = {
   series: {
      cursor: 'pointer',
      point: {
         events: {
            click: function (e) {
               hs.htmlExpand(null, {
                  pageOrigin: {
                     x: e.pageX || e.clientX,
                     y: e.pageY || e.clientY
                  },
                  headingText: this.series.name,
                  maincontentText: Highcharts.dateFormat('%A, %b %e, %Y', this.x)
                     + ':<br/> ' + this.y + ' visits',
                  width: 200
               });
            }
         }
      },
      marker: {
        lineWidth: 1
      }
   }
}
䴺冋
highcharts_line_ajax.htm
<html>
<head>
<title>Highcharts Tutorial</title>
   <script src="http://ajax.googleapis.com/ajax/libs/jquery/2.1.3/jquery.min.js"></script>
   <script src="http://code.highcharts.com/highcharts.js"></script>
   <script src="http://code.highcharts.com/highcharts-more.js"></script>
   <script src="http://code.highcharts.com/modules/data.js"></script>
</head>
<body>
<div id="container" style="width: 550px; height: 400px; margin: 0 auto"></div>
<script language="JavaScript">
$(document).ready(function() {
   var title = {
      text: 'Daily visits at www.highcharts.com'
   };
   var subtitle = {
      text: 'Source: Google Analytics'
   };
   var xAxis = {
      tickInterval: 7 * 24 * 3600 * 1000, // one week
      tickWidth: 0,
      gridLineWidth: 1,
      labels: {
         align: 'left',
         x: 3,
         y: -3
      }
   };
   var yAxis = [{ // left y axis
         title: {
            text: null
         },
         labels: {
            align: 'left',
            x: 3,
            y: 16,
            format: '{value:.,0f}'
         },
         showFirstLabel: false
      },{ // right y axis
         linkedTo: 0,
         gridLineWidth: 0,
         opposite: true,
         title: {
            text: null
         },
         labels: {
            align: 'right',
            x: -3,
            y: 16,
            format: '{value:.,0f}'
         },
         showFirstLabel: false
      }
   ];

   var tooltip = {
      shared: true,
      crosshairs: true
   }

   var legend = {
      align: 'left',
      verticalAlign: 'top',
      y: 20,
      floating: true,
      borderWidth: 0
   };

   var plotOptions = {
      series: {
         cursor: 'pointer',
         point: {
            events: {
               click: function (e) {
                  hs.htmlExpand(null, {
                     pageOrigin: {
                        x: e.pageX || e.clientX,
                        y: e.pageY || e.clientY
                     },
                     headingText: this.series.name,
                     maincontentText: Highcharts.dateFormat('%A, %b %e, %Y', this.x)
                        + ':<br/> ' + this.y + ' visits',
                     width: 200
                  });
               }
            }
         },
         marker: {
            lineWidth: 1
         }
      }
   }

   var series =  [{
         name: 'All visits',
         lineWidth: 4,
         marker: {
            radius: 4
         }
      }, {
         name: 'New visitors'
      }]

   var json = {};

   json.title = title;
   json.subtitle = subtitle;
   json.xAxis = xAxis;
   json.yAxis = yAxis;
   json.tooltip = tooltip;
   json.legend = legend;
   json.series = series;
   json.plotOptions = plotOptions;

   $.getJSON('http://www.highcharts.com/samples/data/jsonp.php?filename=analytics.csv&callback=?', function (csv) {
      var data = {
         csv: csv
      };
     json.data = data;
     $('#container').highcharts(json);
   });
});
</script>
</body>
</html>
䂷悩
黯臕䂷悩㔗


