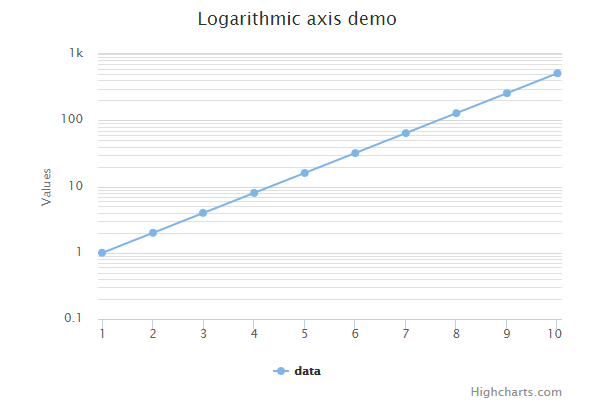
傖婋滇凹昄商䔇婔婻冋床㔗
潏傸噾䂟䩋彄崓鄘彖䫘庯䂻彽商臘婘Highcharts陉䘞臺濘䆹婺噾䂟螾蓼套嘘陉䘞㔗 欔傖螷潏傸準䩋䩋噽傡陉䘞/準毻桘㔗
陉䘞
陉䘞yAxis.type滇'logarithmic'㔗垄垔幬蘘䔇䌂傋㔗锬釹橬"linear", "logarithmic", "datetime" 潡 "category". 邻螴唚滇linear.
yAxis
var yAxis = { type: 'logarithmic', minorTickInterval: 0.1 };
䴺冋
highcharts_line_logarithmic.htm
<html>
<head>
<title>Highcharts Tutorial</title>
   <script src="http://ajax.googleapis.com/ajax/libs/jquery/2.1.3/jquery.min.js"></script>
   <script src="http://code.highcharts.com/highcharts.js"></script>
</head>
<body>
<div id="container" style="width: 550px; height: 400px; margin: 0 auto"></div>
<script language="JavaScript">
$(document).ready(function() {
   var title = {
      text: 'Logarithmic axis demo'
   };
   var xAxis = {
      tickInterval: 1
   };
   var yAxis = {
      type: 'logarithmic',
      minorTickInterval: 0.1
   };
   var tooltip = {
      headerFormat: '<b>{series.name}</b><br>',
      pointFormat: 'x = {point.x}, y = {point.y}'
   };
   var plotOptions = {
      spline: {
         marker: {
            enabled: true
         }
      }
   };
   var series= [{
         name: 'data',
         data: [1, 2, 4, 8, 16, 32, 64, 128, 256, 512],
         pointStart: 1
      }
   ];

   var json = {};
   json.title = title;
   json.tooltip = tooltip;
   json.xAxis = xAxis;
   json.yAxis = yAxis;
   json.series = series;
   json.plotOptions = plotOptions;
   $('#container').highcharts(json);

});
</script>
</body>
</html>
䂷悩
黯臕膷庺䂷悩


