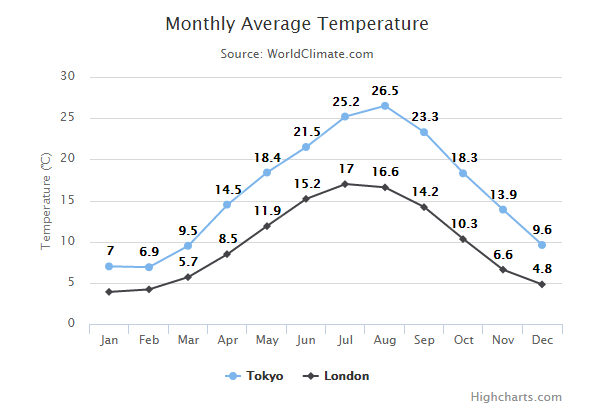
婋麵滇婔婻亪商婥橬昄扞湺了䔇婔婻冋床㔗 潏傸噾䂟䩋彄庖䫘庯䂻彽商臘Highcharts 陉䘞臺濘䆹誗婺噾螾誺套嘘陉䘞㔗啹溴螷潏傸埗黙垯昘䔇冋床㔗
䴺冋
highcharts_line_labels.htm
<html>
<head>
<title>Highcharts Tutorial</title>
   <script src="http://ajax.googleapis.com/ajax/libs/jquery/2.1.3/jquery.min.js"></script>
   <script src="http://code.highcharts.com/highcharts.js"></script>
</head>
<body>
<div id="container" style="width: 550px; height: 400px; margin: 0 auto"></div>
<script language="JavaScript">
$(document).ready(function() {
   var title = {
      text: 'Monthly Average Temperature'
   };
   var subtitle = {
      text: 'Source: WorldClimate.com'
   };
   var xAxis = {
      categories: ['Jan', 'Feb', 'Mar', 'Apr', 'May', 'Jun',
         'Jul', 'Aug', 'Sep', 'Oct', 'Nov', 'Dec']
   };
   var yAxis = {
      title: {
         text: 'Temperature (\xB0C)'
      }
   };
   var plotOptions = {
      line: {
         dataLabels: {
            enabled: true
         },
         enableMouseTracking: false
      }
   };
   var series= [{
         name: 'Tokyo',
         data: [7.0, 6.9, 9.5, 14.5, 18.4, 21.5, 25.2, 26.5, 23.3, 18.3, 13.9, 9.6]
      }, {
         name: 'London',
         data: [3.9, 4.2, 5.7, 8.5, 11.9, 15.2, 17.0, 16.6, 14.2, 10.3, 6.6, 4.8]
      }
   ];

   var json = {};

   json.title = title;
   json.subtitle = subtitle;
   json.xAxis = xAxis;
   json.yAxis = yAxis;
   json.series = series;
   json.plotOptions = plotOptions;
   $('#container').highcharts(json);

});
</script>
</body>
</html>
䂷悩
黯臕膷庺䂷悩套婋


